

BMI Calculator Explained: How to Interpret Your Score and Its Limitations
This article is part of our complete pillar guide: Body & Fashion Sizing — The Complete Guide. Head there for the full breakdown of BMI, shoe sizes, ring sizes, and international clothing systems.
You step on a scale at the doctor's office and a few seconds later a nurse types your height into a computer. Out pops a single number — your BMI, or Body Mass Index. Anything from "underweight" to "obese class III" appears next to it, and suddenly a measurement invented by a 19th-century Belgian statistician is shaping medical decisions about your body. Here is what BMI actually is, what it gets right, and the long list of things it gets badly wrong.
The BMI formula
The formula is simple and identical worldwide:
- BMI = weight (kg) / height² (m²)
If you are working in pounds and inches, multiply the result by 703:
- BMI = (weight in lb × 703) / (height in inches)²
Notice the squared height. That is the whole trick of BMI — it tries to normalize weight for height so that a tall person and a short person can be compared on a single number.
Worked example
Take an adult who is 70 kg and 175 cm tall:
- 175 cm = 1.75 m
- 1.75² = 3.0625 m²
- 70 / 3.0625 = 22.9 BMI
That falls comfortably in the "normal" range. Run your own numbers through our BMI converter, which supports both metric and imperial inputs and displays a color-coded scale.
The four (technically six) categories
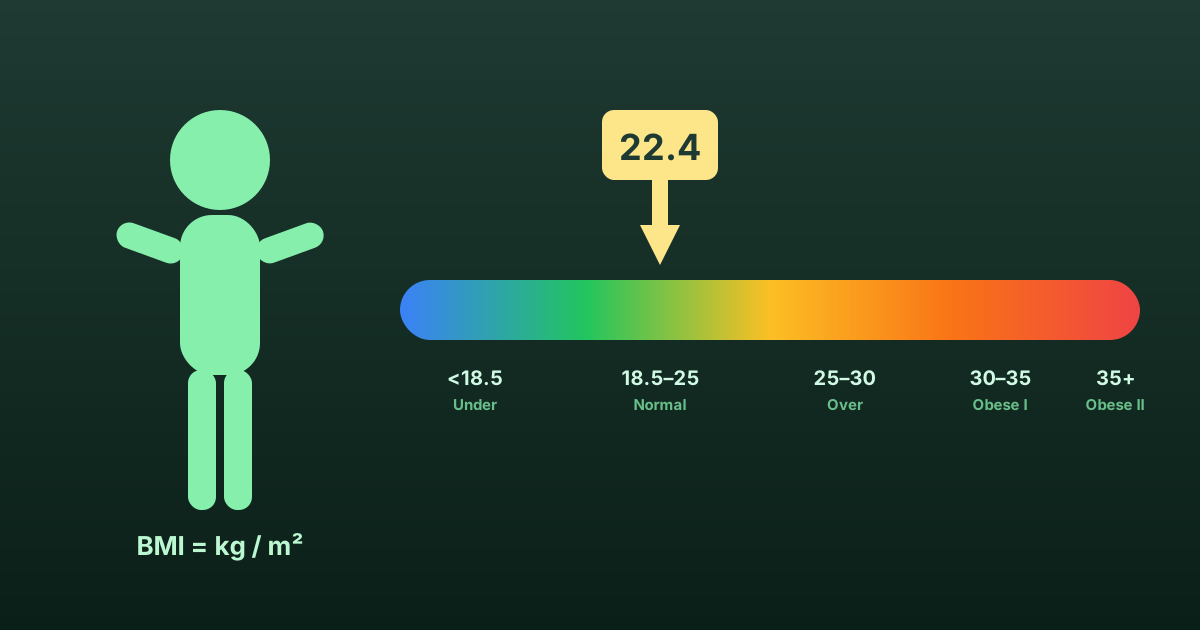
The World Health Organization classification, used in most of the world:
| BMI range | Category |
|---|---|
| Below 18.5 | Underweight |
| 18.5 to 24.9 | Normal / healthy weight |
| 25.0 to 29.9 | Overweight |
| 30.0 to 34.9 | Obese class I |
| 35.0 to 39.9 | Obese class II |
| 40.0 and above | Obese class III (severe) |
Some clinical guidelines further split "underweight" into mild, moderate, and severe (below 16.0). And many physicians informally treat 23.0–24.9 as a "watch list" range because cardiometabolic risk starts rising slightly before BMI 25.
A history nobody tells you
Here is the part of the BMI story that gets left out of doctor's-office posters.
BMI was invented by Adolphe Quetelet, a Belgian astronomer and statistician, in 1832. Quetelet was not a doctor. He was not even a biologist. He was a mathematician obsessed with applying statistical methods to human populations — what he called "social physics." He wanted a simple way to characterize the average body, not to diagnose individuals.
The formula sat in obscurity for over a century until 1972, when American physiologist Ancel Keys ran a large study comparing different weight-height indices against measured body fat. Keys found that Quetelet's old formula (which he renamed the Body Mass Index) was the best of a mediocre lot. He explicitly warned that it was a tool for population studies, not individual diagnosis.
The medical world ignored that warning. By the 1980s, US insurance companies were using BMI to set premiums. By 1998, the National Institutes of Health adopted the current cutoffs and overnight reclassified about 25 million Americans from "normal" to "overweight." The number for "obese" dropped from 30 to 27.3 and then back to 30 across various revisions.
💡 Fun fact: Adolphe Quetelet, the man who invented BMI, was an astronomer who never treated a patient in his life. He designed the formula to study populations, not individuals — and he would probably be horrified that it is now stamped on every medical chart.
Why BMI fails for athletes
The biggest, most cited flaw: muscle is denser than fat. Roughly 1.06 g/cm³ for muscle versus 0.9 g/cm³ for adipose tissue. A pound of muscle takes up less volume than a pound of fat — which means a muscular person looks lean but weighs more, and their BMI shoots up.
Consider:
- LeBron James (NBA): 6'9", 113 kg → BMI ≈ 26.7 → "overweight"
- Tom Brady (NFL): 6'4", 102 kg → BMI ≈ 27.6 → "overweight"
- Most male rugby forwards: BMI routinely 30+ → "obese"
These are not overweight people. They are elite athletes with extremely low body-fat percentages. BMI cannot tell the difference between a slab of quad muscle and a slab of visceral fat — it only sees weight per unit height.
The same trap works in reverse: a sedentary person with very little muscle but a normal BMI can have alarmingly high body fat (so-called "skinny fat" or normal-weight obesity). Their BMI says "healthy," their internal lipid panel says otherwise.
Ethnic and population adjustments
BMI cutoffs were derived primarily from white European and North American populations. They do not transfer cleanly to other groups.
- South Asian populations (Indian, Pakistani, Bangladeshi, Sri Lankan): tend to carry more visceral fat at a given BMI. Many guidelines lower the "overweight" cutoff to 23.0 and the "obese" cutoff to 27.5.
- East Asian populations (Chinese, Japanese, Korean): similar adjustment — the WHO Western Pacific region recommends 23.0 / 25.0 as the cutoffs.
- Pacific Islander populations: tend to have higher lean mass at a given BMI; some researchers argue the cutoffs should be raised to 26.0 / 32.0.
- Black populations (particularly African American): tend to have higher lean mass and bone density, and BMI overestimates body fat slightly relative to white populations.
| Population | Overweight threshold | Obese threshold |
|---|---|---|
| WHO default (mainly European) | 25.0 | 30.0 |
| South Asian | 23.0 | 27.5 |
| East Asian (WHO WPRO) | 23.0 | 25.0 |
| Pacific Islander (proposed) | 26.0 | 32.0 |
This is not a fringe view — it is the official position of the WHO regional offices for Asia.
💡 Fun fact: A BMI of 26 in a South Asian patient signals roughly the same metabolic risk as a BMI of 30 in a Northern European patient. The same number means very different things in different bodies.
Better alternatives
If BMI is so flawed, what should you use? A few alternatives have stronger evidence as individual-level health predictors.
Waist-to-height ratio (WHtR)
Just divide your waist circumference by your height. Aim for below 0.5. This single number predicts cardiovascular risk better than BMI in most studies because waist circumference captures abdominal (visceral) fat, which is the dangerous kind. Easy mantra: "Keep your waist to less than half your height."
Body-fat percentage
Measured by DEXA scan, bioelectrical impedance, hydrostatic weighing, or skin-fold calipers. Healthy adult ranges are roughly:
- Men: 10–20%
- Women: 18–28%
DEXA is the gold standard but expensive. Smart bathroom scales using impedance are cheap and convenient but only accurate to ±3–5%.
Waist-to-hip ratio (WHR)
WHO risk thresholds: above 0.90 for men and 0.85 for women indicates elevated cardiometabolic risk. Simple, free, surprisingly predictive.
Combined approach
The most pragmatic approach is to use BMI plus waist circumference. If your BMI is high but your waist is small (and you exercise), you are probably fine. If your BMI is "normal" but your waist is over half your height, you may still be at risk. Two cheap, fast measurements paint a much fuller picture than either alone.
Kids' BMI: percentiles, not ranges
For children and adolescents (ages 2–19), BMI is interpreted using percentile charts rather than fixed cutoffs, because kids' body composition changes dramatically through puberty.
| Percentile | Category |
|---|---|
| Below 5th | Underweight |
| 5th to 84th | Healthy weight |
| 85th to 94th | Overweight |
| 95th and above | Obese |
A boy whose BMI is 19 at age 10 might be in the 90th percentile; the same BMI at age 16 might be in the 30th. Pediatricians use the CDC or WHO growth charts to interpret.
Sibling reading
For the broader story of how we ended up using kilograms in some places and pounds in others — which is unavoidable when you actually try to compute your own BMI — see our piece on Pounds vs Kilograms.
Key takeaways
- BMI = weight (kg) / height² (m²), with categories at 18.5, 25, 30, 35, and 40.
- It was invented in 1832 by an astronomer for population studies, not individual diagnosis.
- It systematically misclassifies muscular people as overweight and "skinny fat" people as healthy.
- Asian populations should use lower cutoffs (23.0 / 25.0–27.5).
- Waist-to-height ratio under 0.5 and body-fat percentage are better individual predictors.
- For kids, BMI is read as a percentile against age-and-sex-matched growth charts.
FAQ
What's a healthy BMI?
For most adults of European descent, 18.5 to 24.9 is labeled "normal." For South and East Asian adults, the healthy upper limit is closer to 22.9. For children, healthy is the 5th to 84th percentile on age-and-sex-matched growth charts.
Is BMI accurate for athletes?
No, frankly. BMI cannot distinguish muscle from fat, so muscular athletes routinely score as "overweight" or "obese" while having single-digit body-fat percentages. For athletes, use body-fat percentage or waist-to-height ratio instead.
What's the best alternative to BMI?
Waist-to-height ratio is the easiest and arguably the best single alternative. Keep your waist circumference below half your height. For a more complete picture, combine BMI with waist circumference and a body-fat measurement (DEXA scan if you have access, smart scale if you do not).
Does BMI work the same for all ethnicities?
No. South Asian and East Asian populations carry more visceral fat at the same BMI as European populations, so the healthy thresholds are lower (around 23 instead of 25). Pacific Islander populations may need higher thresholds. The WHO publishes adjusted regional cutoffs that most local guidelines now follow.